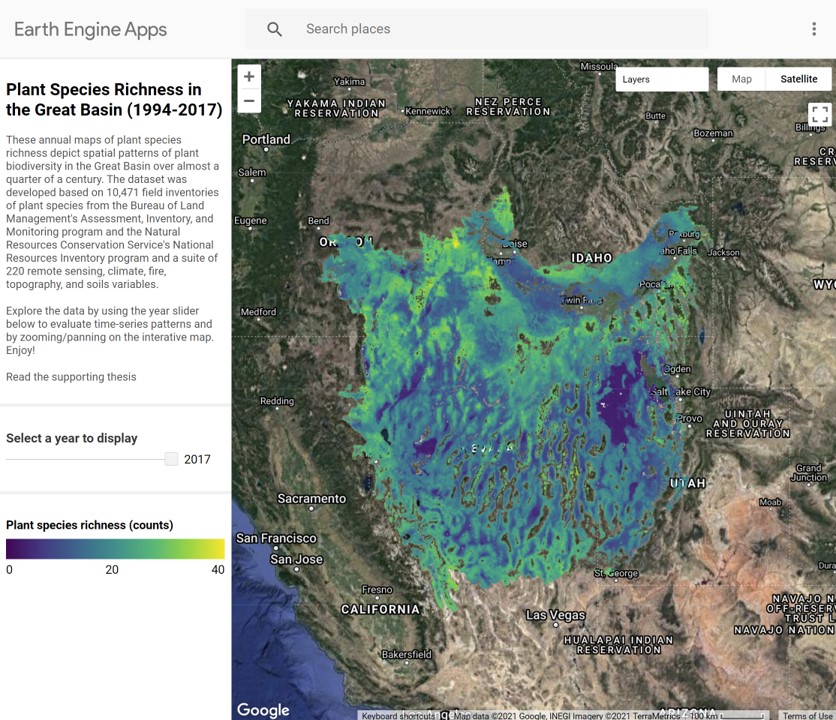
Great Basin Plant Diversity Modeling (1994-2017)
This Google Earth Engine web application provides visualization of plant species richness patterns for the Great Basin between 1994-2017. The dataset was developed based on 10,471 field inventories of plant species from the Bureau of Land Management's Assessment, Inventory, and Monitoring program and the Natural Resources Conservation Service's National Resources Inventory program and a suite of 220 remote sensing, climate, fire, topography, and soils variables.
- Project lead Eric Jensen
- Collaborators Jody Vogeler
- Website Web Application
- Tools Google Earth Engine, R, ArcGIS Pro
- Completed December 2020
ABOUT THE PROJECT
Visit the web application here!
Information about the dataset
We modeled plant species richness directly using both the Landsat remote sensing variables and environmental variables. In total, we analyzed 220 predictor variables including spectral diversity, raw Landsat variables, soils, climate, fire, and topography variables. For modeling, we used Random Forest packages in R to perform variable selection, model training, and model validation. We then applied the Random Forest model to produce maps of predicted species richness across our study area for each year between 1994–2017. We also evaluated the relative importance of the predictor variables to assess drivers of species richness
The predictive model was a much better predictor of plant species richness than spectral diversity measures alone. The final model after variable reduction included 21 predictor variables related to topography, soils, climate, fire characteristics, as well as spectral information. This combined environmental and spectral variable model had an r-squared value of 0.52, a root mean square error of 6.69, and mean absolute error of 5.03 based on a validation set of 1,561 plots (Figure 4). Of the predictor variables, many precipitation and aridity variables ranked highly, with 11 of the 21 variables in the model being either measures of precipitation or aridity. Relatively few spectral variables were selected for the final model and none of the spectral diversity predictors were selected.
About the Web Application
The annual maps of plant species richness depict spatial patterns of plant biodiversity in the Great Basin over almost a quarter of a century. The dataset was developed based on 10,471 field inventories of plant species from the Bureau of Land Management's Assessment, Inventory, and Monitoring program and the Natural Resources Conservation Service's National Resources Inventory program and a suite of 220 remote sensing, climate, fire, topography, and soils variables.Explore the data by using the year slider below to evaluate time-series patterns and by zooming/panning on the interative map. Enjoy!