RAP BLM Allotment Reporter
This web application built off of the Kleinhesselink, et al. (2022) and the RAP Production Explorer to provide analysis of vegetation status and trend for all Bureau of Land Management Allotments. It provides analysis of vegetation cover, historical vegetation productivity, current year vegetation productivity, an estimate of the stocking, and comparison of allotments to broader spatial scales.
- Project lead Eric Jensen
- Collaborators Brady Allred, Matt Jones, Dave Naugle, Andy Kleinhesselink
- Website Link to Prototype
- Tools R, R Shiny, Leaflet, HTML, CSS, Mapbox
- Completed In progress
ABOUT THE PROJECT
See the prototype web application here!
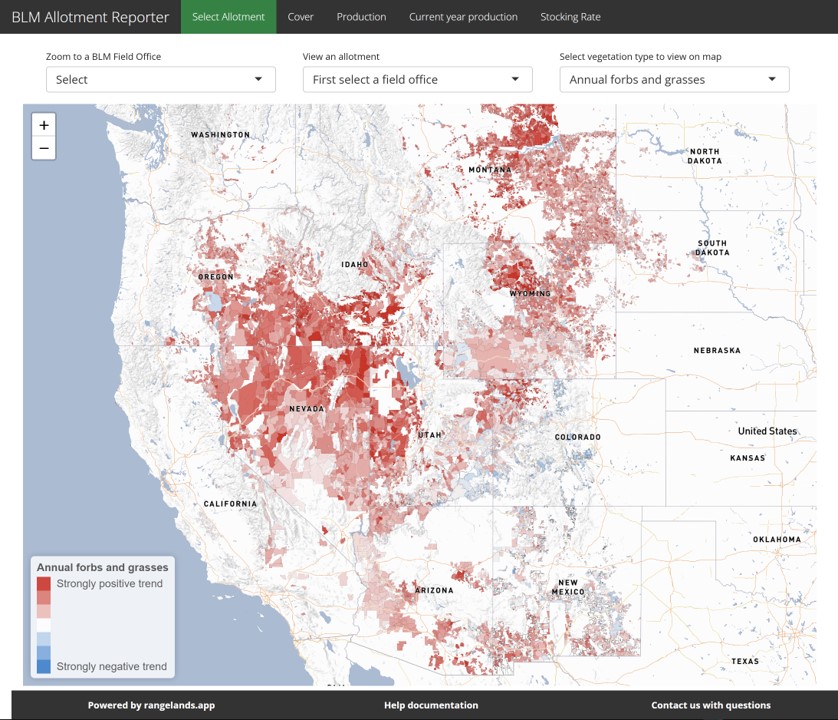
The BLM Allotment Reporter is a web application that I developed in R Shiny using leaflet, Mapbox vector tiles, ggplot2, dt, custom CSS, and custom Javascript. In addition to providing an interactive user interface for exploring vegetation status and trend data including vegetation cover, historical productivity, current year productivity, an estimate of the stocking, and comparison of allotments to broader spatial scales, it also allows the user to export Excel reports that are formatted to print using the openxlsx package. This tool is currently in development and is being co-produced in collaboration with the BLM National Operations Center.
Key features of the application include the ability to:
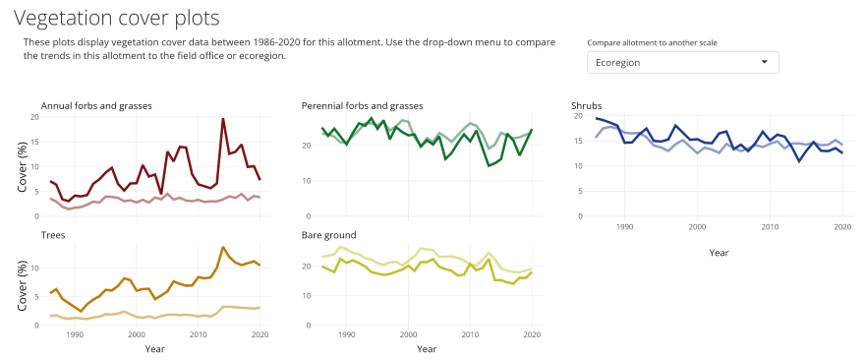
- Visualize trends in vegetation cover and productivity over 35 years.
- Compare vegetation cover and productivity across scales.
- Evaluate productivity compared to long-term averages.

- Estimate stocking rates and visualize variability in proper stocking.
