RAP Production Explorer
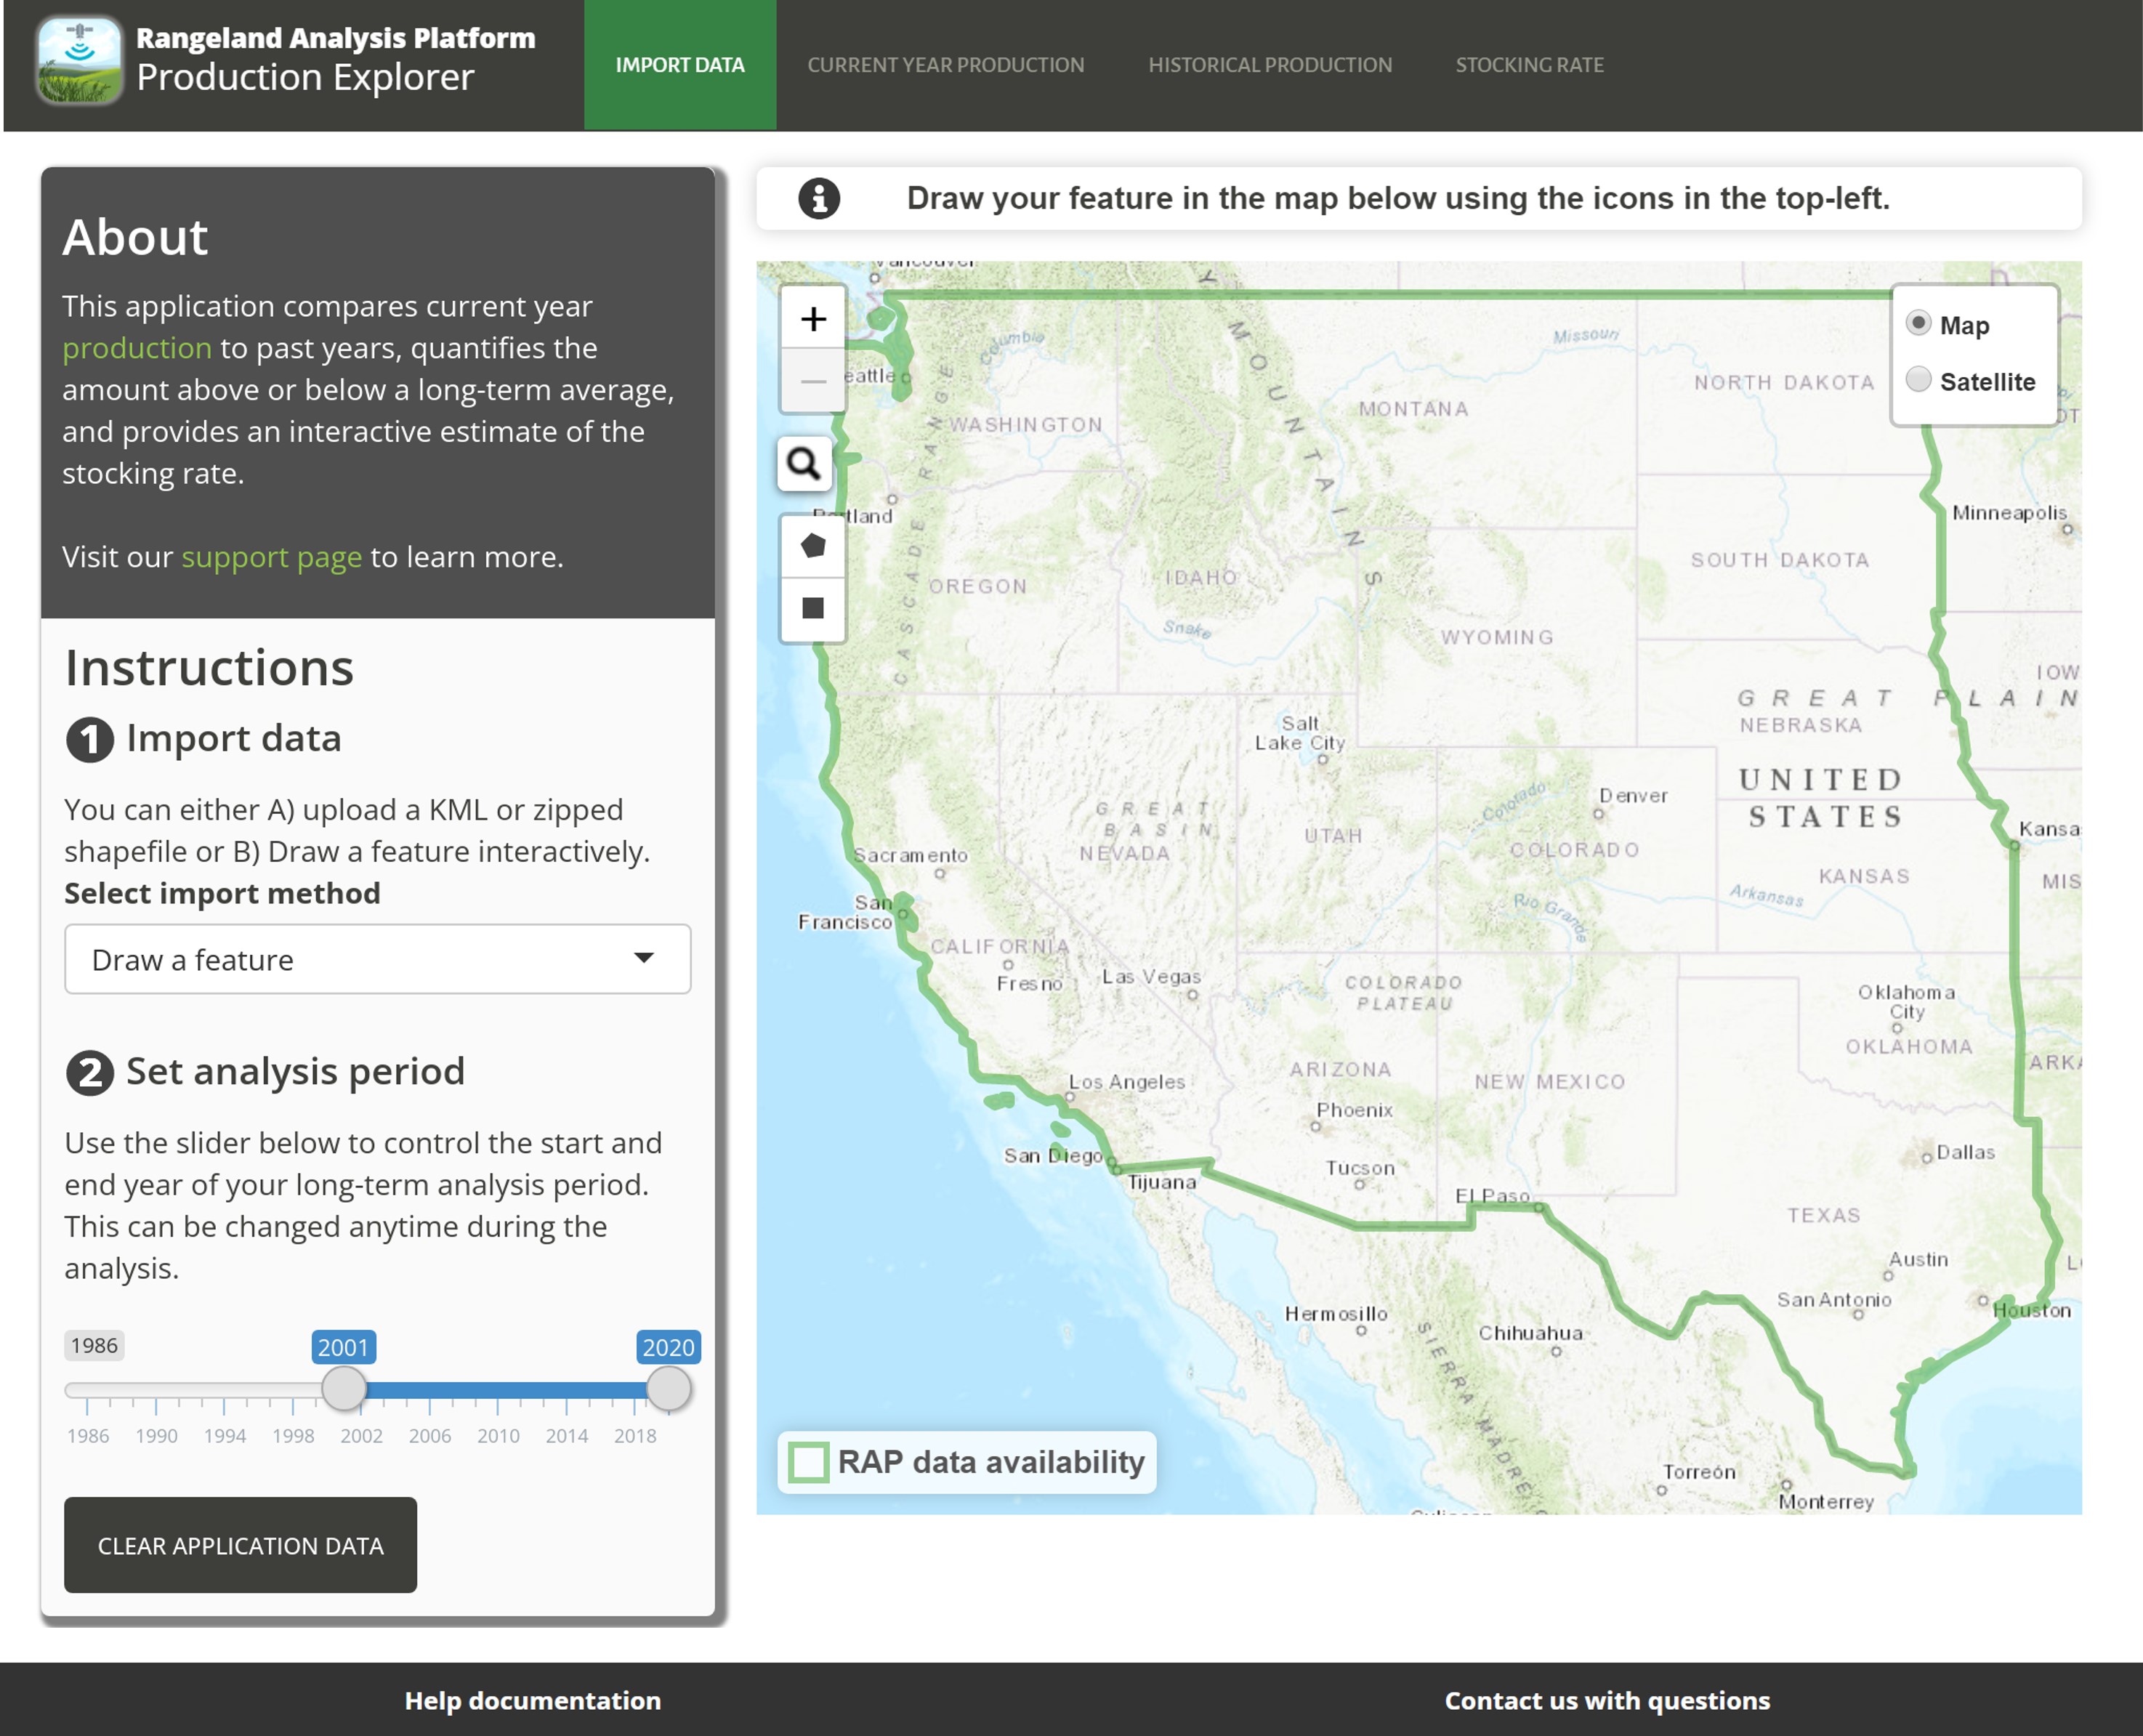
This RAP Production Explorer compares current year production to past years, quantifies the amount above or below a long-term average, and provides an interactive estimate of the stocking rate.
- Project lead Eric Jensen
- Collaborators Brady Allred, Matt Jones, Dave Naugle, Doug Spencer
- Website Web application
- Tools R, R Shiny, Leaflet, Mapbox, HTML, CSS
- Completed September 2021
ABOUT THE PROJECT
See the web application here!
The Rangeland Analysis Platform (RAP) Production Explorer is a tool that I developed to enable users to perform custom analysis and generate reports on vegetation productivity for any location in the western US. Specifically the tool provides 1) estimates of near-real-time rangeland production for the current year; 2) long-term production variability and comparison; 3) stocking rate estimations based on user-defined specifications; and 4) printable reports, maps, tables, and charts so that you can take the data with you.
I developed the tool using R Shiny and associated R bindings for leaflet, plotly, and other packages. Importantly, the Production Explorer ingests shapefile, KML, or user-drawn polygon features, sends a POST request to the RAP API parsing the coordinates of the polygon as a geoJSON, parses the geoJSON received from the API into an R data frame, and generates the various plots and figures. The UI allows the user to adjust the period of interest and to provide custom specifications for estimating stocking rates. I also provided functionality for generating printable Excel reports that include all maps, charts, and data tables using the OpenXLSX package.
Learn more about the Production Explorer in the tweet thread below:
Very excited to publicly share the Rangeland Analysis Platform Production Explorer web tool! https://t.co/mJa4YUGdtR
— Eric Jensen (@RangeSpatialist) September 30, 2021
This FREE tool allows users to evaluate vegetation productivity and estimate stocking rates for anywhere in the western US.
So, how does it work? 🧵1/n
Released in September 2021, the tool is already being implemented by USDA Natural Resources Conservation Service and Bureau of Land Management staff across the West for varied applications including reporting on CRP, informing grazing plans, and evaluating impacts of management on productivity. It frequently is being used 15 hours+ per day by multiple users at a time for much of the time.